Entradas

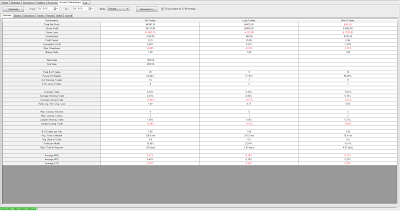
Short Waiting for the end of the correction. IBEX 35

Imagen
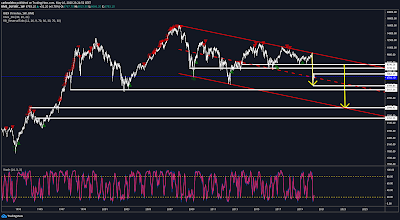
When everybody talk about to buy it's time to sell, last week Golman Sach, Merrill Lynch, Morgan Stanley and many others has said that we had see the botton. So, from my point of view its clair. It's time to look for short opportunities, between alls one of the weakest is the IBEX 35,  benchmark index of the spanish market.With a potencial gain around 14% on short termes and 45% in the long termes. A close below 6.600 is the first signal to get short about a Stop above 7.230 points. Today we have the first clue in the intraday chart, we wait the confirmation with a close below 6.600 point to get short in the market. Take care and good week in the markets!!!

Today OPEC's Meeting

Hi trader, Today we have the OPEC's meeting so be careful on the market. It's important remember that we are in a bearish market and it can go down at anytime. OPEC MEETING Good Bye and Good Trading.

Closing Bell

Imagen
Hi everyone, Finally markets moved up after their break their resistance. The discordant note has been crude who today close in negative. Nevertheless it reached a new high this week. A continuación the results of my trading week and month. Today Live Trading in Crude Everyone has bolted for the weekend, so see you on Monday. Good Bye , Good Trading and Good Weekend.

Premarket 20/05/2016

Imagen
Hi everyone, Today we have another bearish day ahead, at least the chart told us. We have two major exceptions the NQ, YM looks the same but the long trend is bearish, the CL is now bearish but we know that the long trend is very bullish and we can see a reversal anytime. On the other hand we have not major news for today's session. YM: I expect a rotation to the high of the bearish channel around 17.500 this is a very strong resistence and if we see a close above this area we should see new highs. Anyway I expect that price after this level move down and close below of the yesterday's lows. TF: This chart remains very bearish, and also expect a rotation to the channel's high and then a rotation to the lows. The alternative scenario will be is we see a close above 1100. NQ:  Yesterday we had a false breakout and from this point the price is moving inside the bullish channel. I the price move out the channel and close below 4300 probably we will

Closing Bell 19-05-2016

Hi everyone, Today market move as predicted in the premarket. The markets went down and Crude went up, so the Crude is very bullish but, how long we can see a bullish Crude in a bearish market? Well I have no idea the only thing that I know is that we must follow the trend and that's all. For tomorrow we can expect more or less the same session that we had today. Here you can find some of my trades that I took today. If hope that you enjoy them. Crude Oil Trading 19 May Good Bye and Good Trading.

Premarket 18/05/2016

Imagen
Hi everyone, Today the markets looks bearish, so is a good day to see a reversal on the market. CL. Yesterday the Crude Oil reversal at 49,50 and the price reached 47,45 now the price is moving out the bearish channel. If the price goes above 48,00 we can see a new highs today. If not, the support is 47,00-46,50. I don't expect a close belows this level. TF: Bearish market too, and the chart shows us a relevant support at 1090, If the price lost the yellow line we can expect new lows. If we see the price out the bearish channel and a close above 1100 we will see new highs for today. YM: The price is sideways the support is set at 17400 and the resistence 17500. I a large range but should wait until the price goes above or below. Right now the price is moving in the bearish channel but the main movement is sideways and we should wait a breakout. NQ: Another sideways market, despite the market is moving inside the bearish channel. If we see a cl

Market Review Crude Week 19

Imagen
Hi everyone Last week we saw a little retracement on crude, on the Friday's session the price hold the level 44,00. In a nut shell, nothing on the chart and change it any continues bullish. Dollar Index: If the Crude remains bullish, This chart remains bearish and now the price rebound from the 0.382 Fibonacci Level and Present from the 92.00 level. The price is in the basis of the bearish trend and we can expect a move to 95.00 is obviously the first resistence 94.00 if the price move higher the next level will be 96.00 and frome esta level we can see new lows. VIX: Actually the price in a range. Above 17.00 will be the first clue to see new highs, and end the signal will be a close above 19.00 level. CL M: In This chart we can see a clear resistence on 46.50 if the price close above 47.00 two days I expect that price to reach 50.00 in short time. CL W: Price is moving in a up trend and is now above the 50 moving average, and the first resi